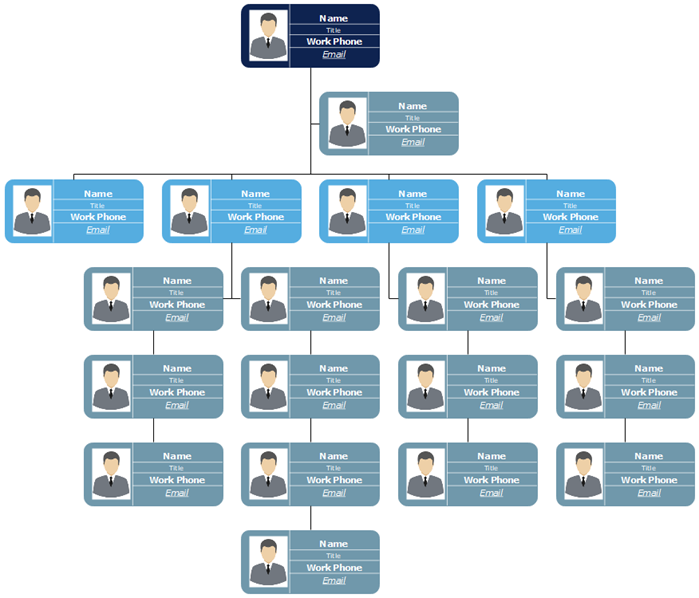
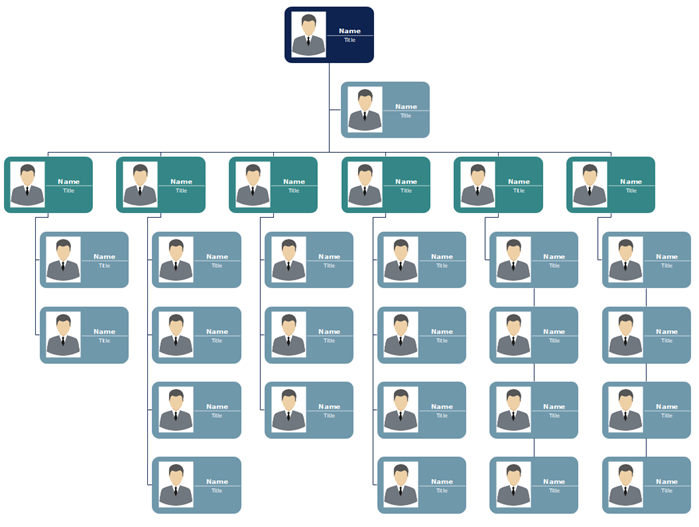
A Hierarchy Chart exhibits the breakdown of a system or an organization into the smallest manageable sections. It is usually a top-down structure and also has a left-right design. In the illustrated diagram, rectangles represent different entities in the system, and lines will be used to connect them. These diagrams look like organizational charts in some ways, and you can use org chart makers to draw hierarchy charts as well.
The Definition Of Hierarchy
The word “Hierarchy“, according to the Cambridge Dictionary, means a system in which people or things are put at various levels or ranks according to their importance. When you work in a company, you will find that your company structure can be illustrated as a hierarchy organizational chart.

What are Hierarchy Charts used for?
Hierarchical charts are described as visual representations of a system of hierarchy and an organization with various levels. Roles, ranks, or positions of people or things are laid out in a graphic format clearly that depicts the relationships between the entities. The top of the chart is generally kept for the most important or significant part of the system. Looking down from the top are the other components of the system. As you may know, the commands and decisions should flow from the top to the bottom in this system of hierarchy.

